Introduction
There are biases that affect measurements due to the proportion of the sampled population. One type of bias is the inspection paradox, which is not well-known but influences almost every measurement. Another example of bias arises when reporting class sizes in a university campus.
The inspection paradox occurs when oversampling individuals who experienced longer wait times or rarer events. For instance, when surveying bus riders, the average reported wait time may be longer than the actual wait time observed in bus data. This is because individuals who caught the bus on time are underrepresented in the survey, resulting in an inflated average wait time.
Example 1: Bus Waiting Times
To better understand the inspection paradox, let’s consider a scenario where a bus has a scheduled frequency of 15 minutes. Imagine conducting a survey and collecting data on the waiting times reported by different bus riders. You discover that the reported average waiting time is around 14 minutes, which is double the expected average of 7-8 minutes based on the bus schedule.
The reason for this disparity lies in the oversampling of individuals who experienced longer wait times. Those who caught the bus on time are underrepresented in the survey, leading to an inflated average. The inspection paradox highlights the influence of sampling biases on measurements and the need to consider them when analyzing data.
Example 2: Class Size Biases
Another example might be the class sizes in university. Biases in class size reporting arise when smaller classes are underrepresented. Taking the mean reported by students differs from the university’s reported mean. For instance, a university may have classes with 100+ students and some with less than 10 students.
Recovering the “True” Distribution
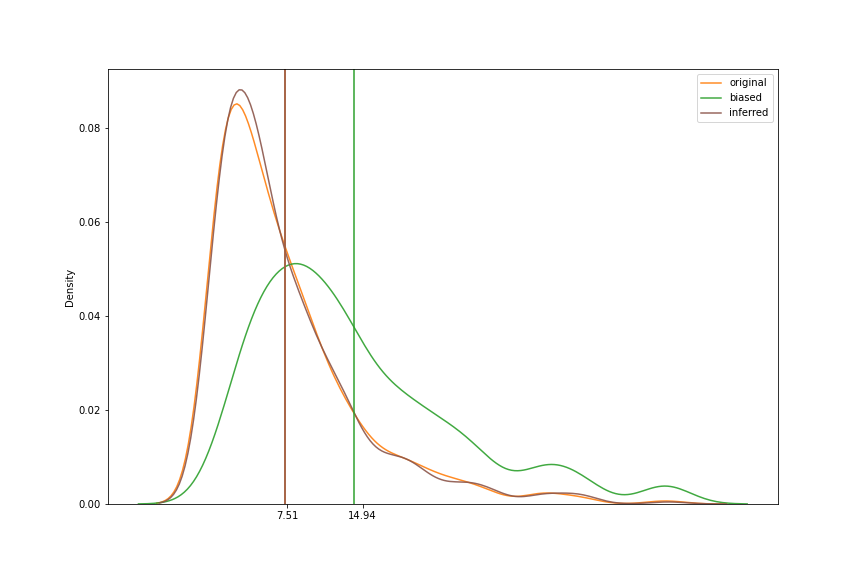
Despite the biases, it is possible to approximate the true distribution. By resampling the survey data with weights proportional to the sample itself, using inverse biases, we can recover an approximation of the true population. The choice function overcompensates and oversamples rarer events due to the adjusted weights.
1
2
3
4
5
6
7
8
9
def resample(sample, weights):
    n = len(sample)
    w = weights / weights.sum()
    return np.random.choice(sample, n, p=w)

true_data = np.random.exponential(7.5, size=1000) # we do not know this

biased = resample(true_data, true_data) # we sample from the true data here (surveying)
inferred = resample(biased, 1/biased)