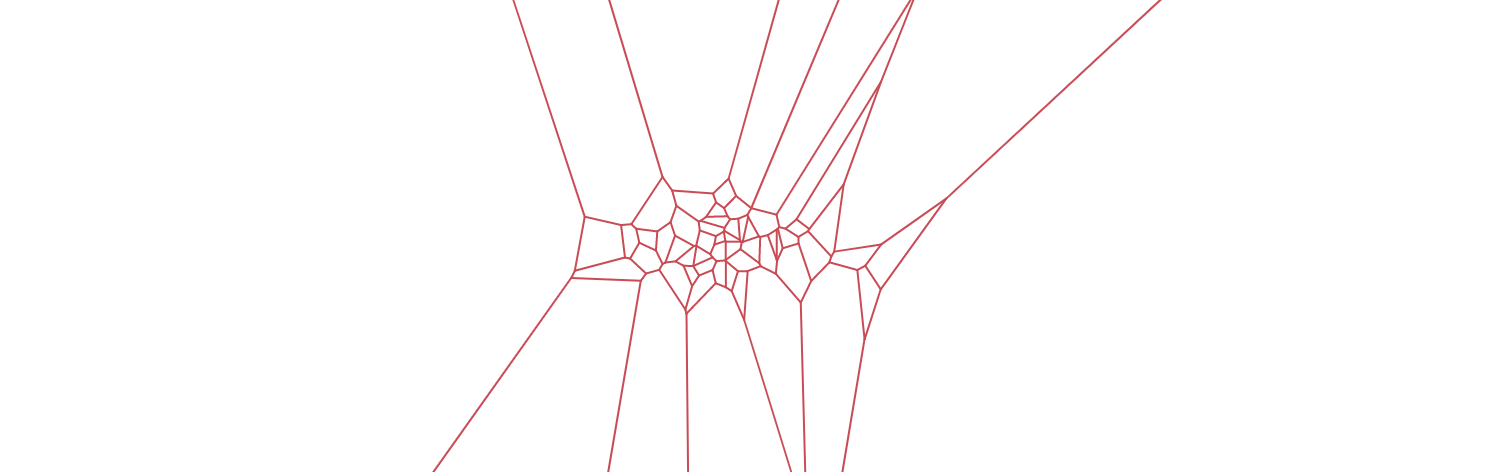
Probably you have noticed that the welcome screen of this blog has a doodle, and they are generated on each refresh of the page. What are these diagrams? Are they just art pieces? Is it easy to get a diagram like that?
Definition
These diagrams are called Voronoi diagrams. They are named after Georgy Voronoy, which defined these tessellations. The formal definition of these diagrams can be summarized like:
\[R_k = \{x \in X | d(x, P_k) \leq d(x, P_j), \forall j \neq k\}\]where \(R_k\) is a Voronoi cell, and \(d(...)\) is a distance metric. This definition is abstract, however easy to digest. The informal definition can be stated as:
A Voronoi cell is defined by each point \(x \in X\) where the distance is smaller to the current \(k\)-th region, rather than some other region \(j\).
In essence it is a minimal distance region of space based on some initial set of points. Now we can see the usefulness of this type of diagram. It’s applications are endless and here in my blog, I use it as a doodle because of the nice patterns this type of tesselation creates.
Applications
Some useful applications of these type of diagrams are in nearest neighbor search, where a typical example is the Knuth’s post-office problem. The problem states that each residence in a town needs to be assigned to the nearest post-office. This is the exact definition of these diagrams. Other alterations of this problem is where to place a new business such that to ensure optimal location of goods. To read more on the latter please look at this paper.
These diagrams are very powerful way to subdivide a given space in an optimal way. In this first part we will look at an introduction to this topic, whereas the second part (and possibly a third) will be more focussed towards case studies.
A very easy way to compute the Voronoi diagram of a set of points using python, is to use the scipy package. You can read more
here.
Caveats
Look again at the the doodle figure in the beginning. You can see a cluster of cells (or polytopes) in the middle, and no boundaries on the the edges. This means that some cells, have infinite are, because there are no “competing” points on that direction, thus, if we zoom out, those regions would continue in a linear path. This is intuitive to think about as if we were on the middle-far left side of the figure, the closest point would be only the point that defines that whole region, thus area of that region is infinite. The cells that are “surrounded” by other points, compete for space with the other points, thus their Voronoi region is bounded and finite.
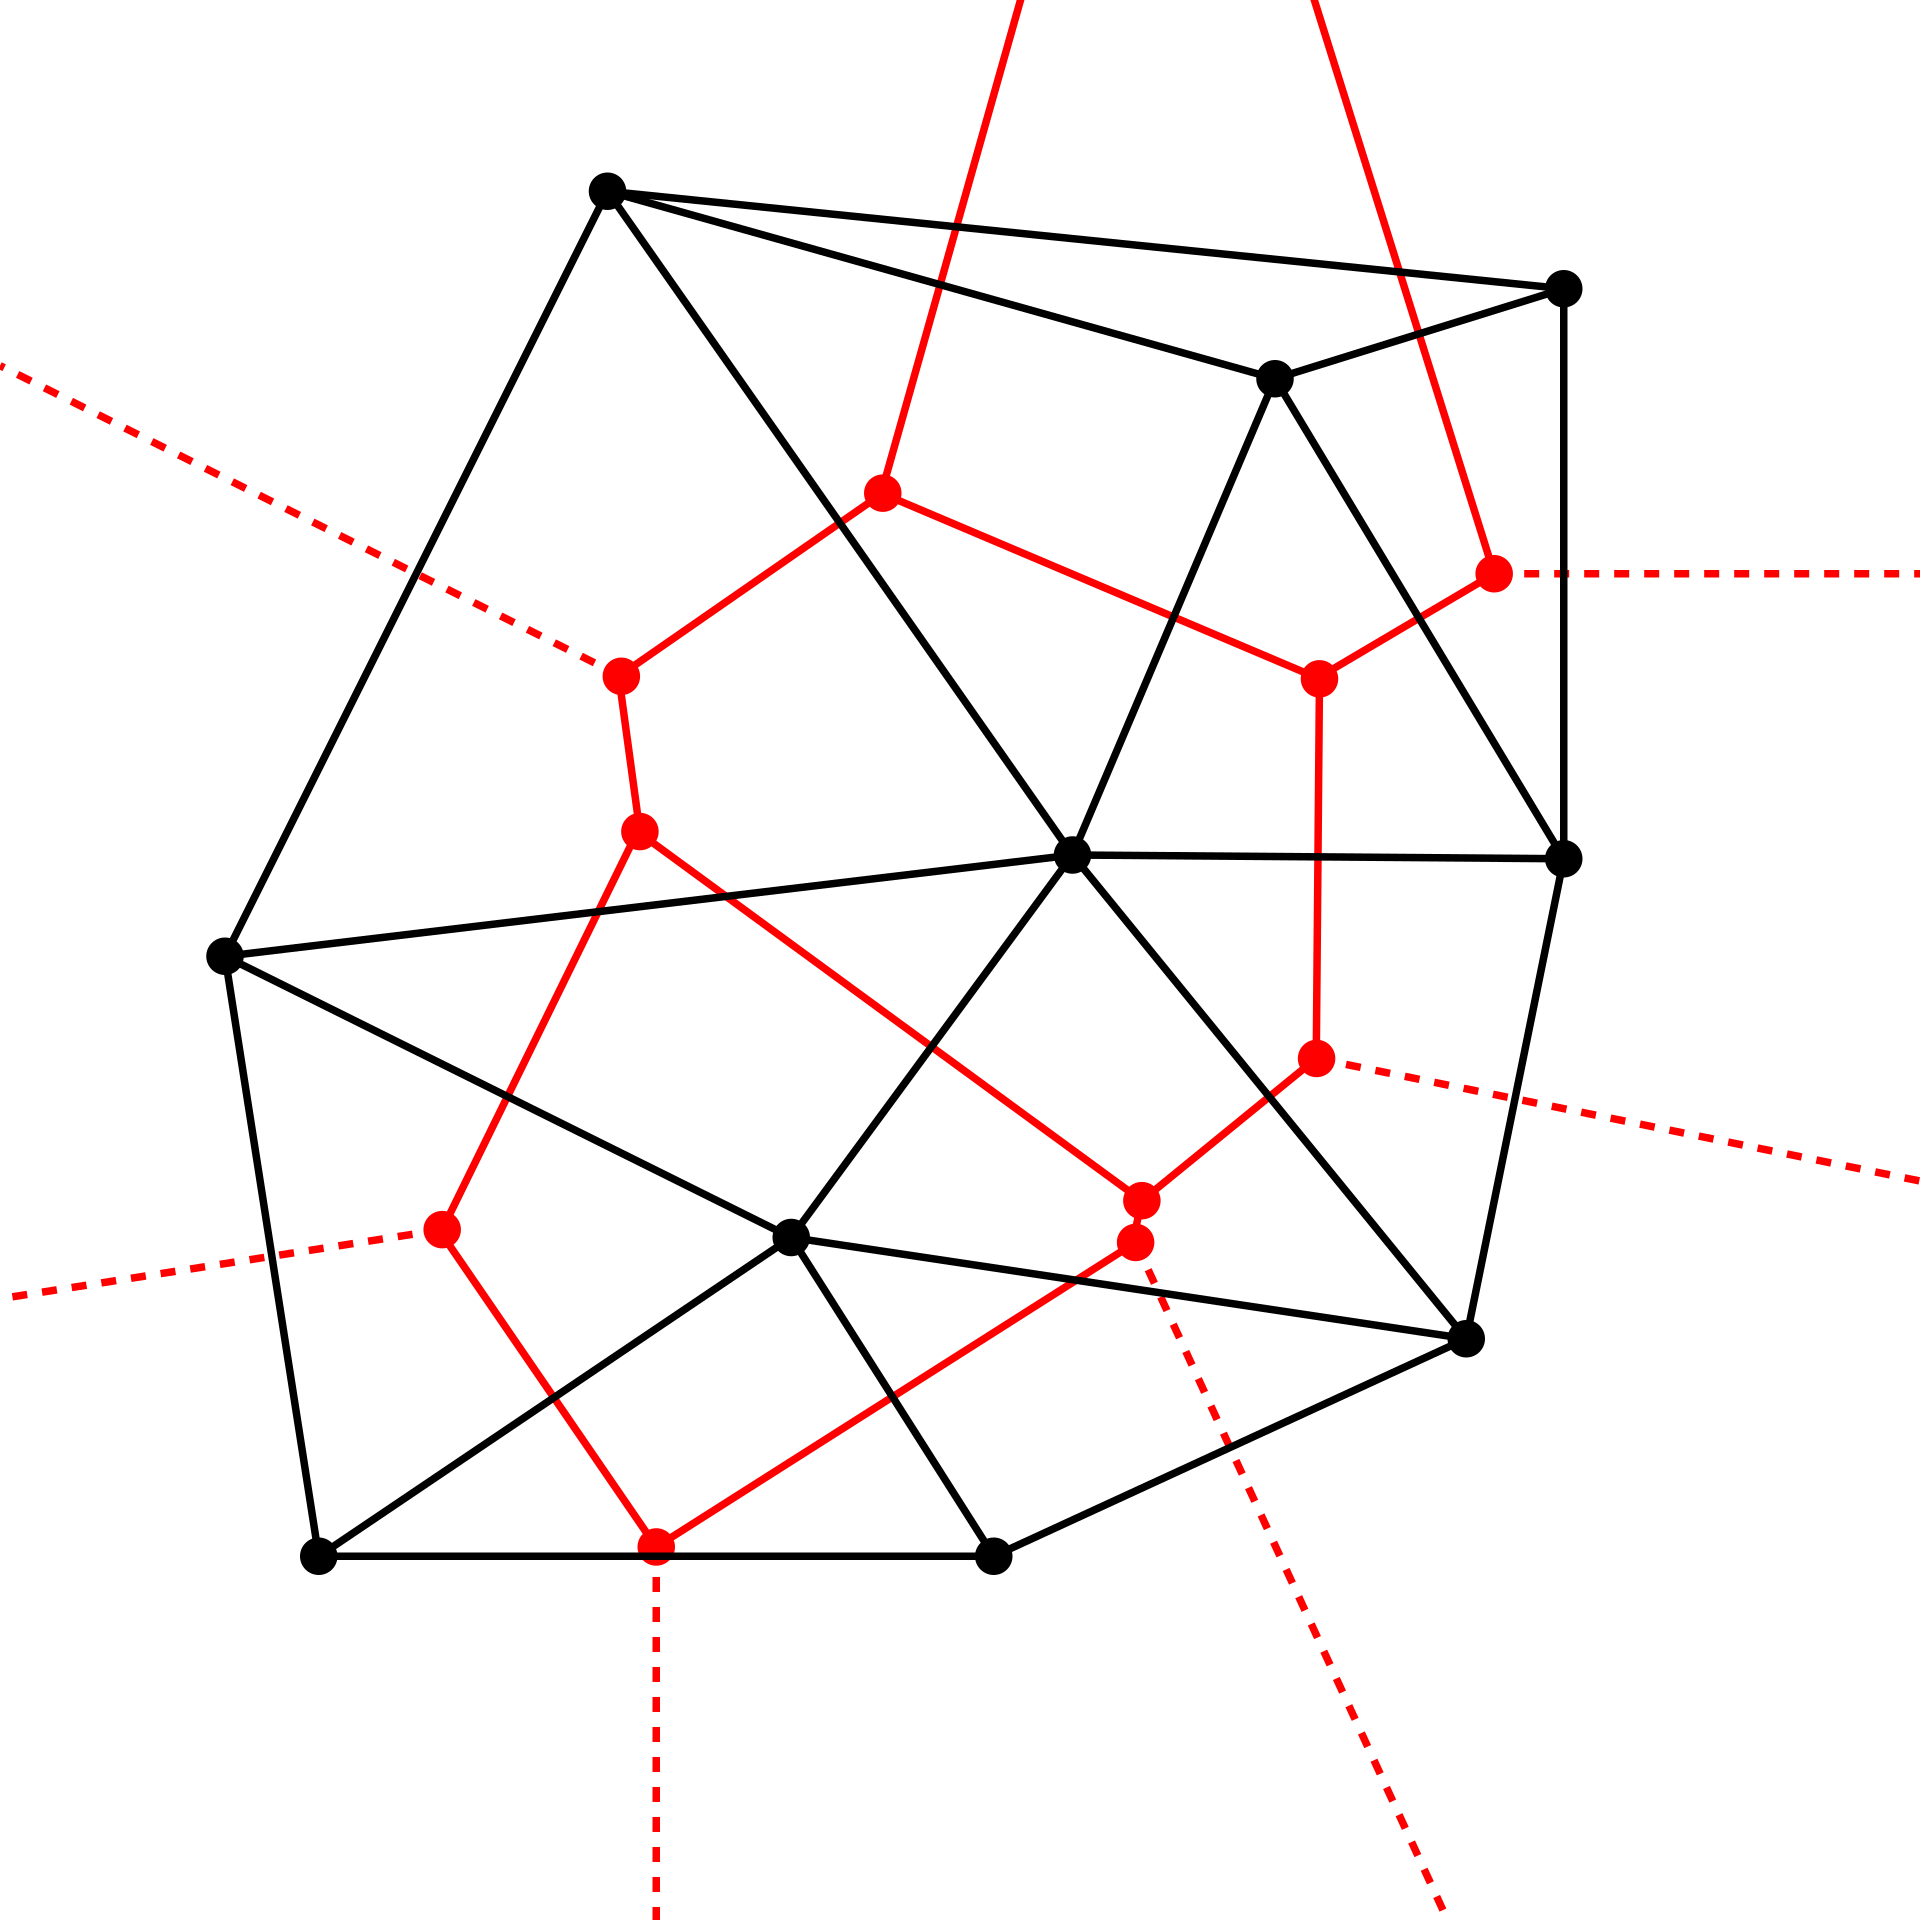
Another caveat of this type of diagram is the dual of the Voronoi diagram, called Delaunay triangulation. This is what it sounds like, a <mathematician> + triangulation. It is a method to form triangles based on a set of input points. This means that a Voronoi diagram and its corresponding triangulation are different perspectives of the same problem. This is also a rabbit hole of cool geometrical interpretations.